Hello fellow investors. It has been too long since I made another blog post. I need to get into the rhythm again. Today I will go back to the basics. A lot of you might already know what candlestick charts are and how to read them. This article is truly for the beginning investors out there! Let’s see what candlesticks are.
Charts
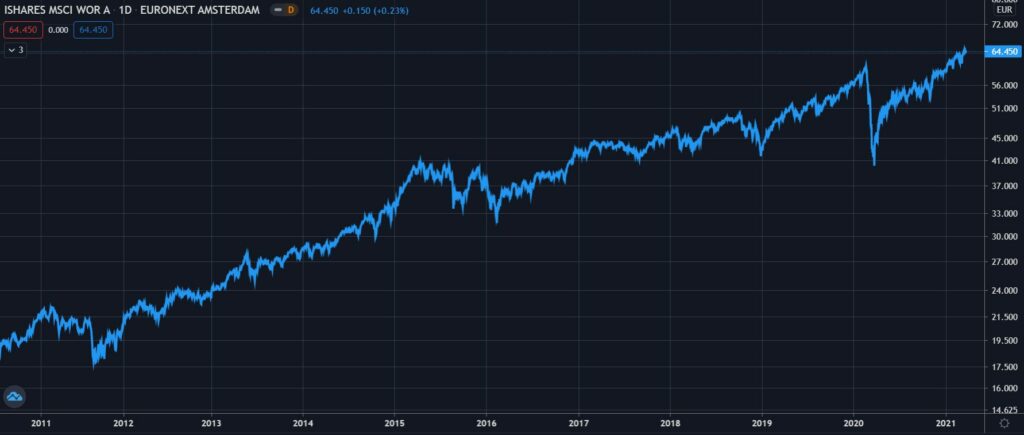
The most basic chart the can show the performance of a stock or other investment is a simple line chart. There is a good chance that this is the type of chart most starting investors are familiar with. A line chart is perfect to show how an investment has performed over a certain time period in the most simple way. On the right, you can see the performance of the main ETF in my portfolio (IWDA) using a line chart.


On the left, you can see a candlestick chart of the same asset. This one is a bit more zoomed in. You can still follow the price action on a chart like this. As you probably notice, this chart contains a bit more information compared to a simple line chart. Let’s take a closer look at the different parts of these candlesticks!
Parts Of A Candlestick
As you can see, a candlestick chart contains multiple candlesticks. Every candlestick in itself represents a certain time period. This time period can be changed in the chart settings. If the candle is green, the price of the asset has risen during this time period. If the opposite is true, the candlestick is red and the price has fallen.
Each candle consists of 3 parts. The upper wick, the body, and the bottom wick. The highest part at the top of the upper wick and the lowest part at the bottom wick show the highest and lowest price during this time period. The (colored) body shows at which price point this time period opened and closed. For a rising green candle, this means that the opening price is at the bottom of the body while the closing price is at the top of the body. The opposite is true for red candles.

Conclusion
As you can see, reading candlestick charts is not hard at all. If you just want a global overview, line charts will do their job just fine. Candlestick charts can bring you that little bit of extra information which could come in handy when making certain investment decisions. Now you should know what candlesticks are. If you have any more questions, don’t hesitate to put them in the comments down below or get in contact with me via email!


